Creating IBM Cognos Portal Pages
Overview:
This month’s Tech Tip article is a two part article that will review the implementation of global filters in Cognos Connection dashboard applications. To demonstrate this technique, we will explain how to pass your prompt selections from one dashboard portlet to other report portlets within the same dashboard page.
In an effort to facilitate the recreation of the samples provided in this article, all examples were written using the “GO Sales (query)” sample package (provided with the default Cognos sample pack) and have been broken down to two simple steps:
- Creating the Report Studio prompts and parameterized reports.
- Creating pages in Cognos Connection.
Step 1: Create the reports in IBM Cognos Report Studio
Before creating the reports, we must create folders in Cognos Connection to hold our reports and portal pages. In “Public Folders”, create a new folder called “Global Filters”. Then, within the “Global Filters” folder create another new folder called “Dashboard Pages”.
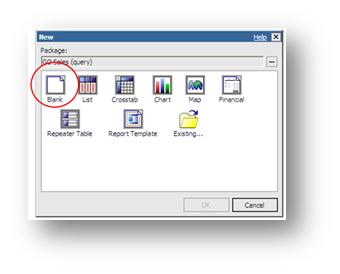
We are now ready to create the reports. We will begin by creating the prompt page that will drive the other report items contained on the dashboard page. To do this, launch Report Studio, create a new report and select the Blank template as shown in the image below.
We are now ready to start creating the prompt page. To do this, begin by going to the Toolbox tab of the Insertable Objects pane and drag a Value Prompt object onto the page. This will trigger the Prompt Wizard.
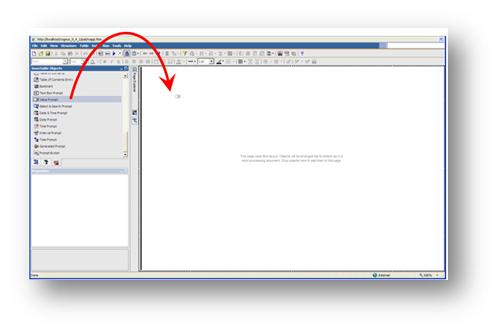
Create the prompt using the following steps:
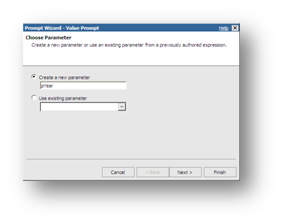
- Create a new parameter name called “pYear” and click Next.
-
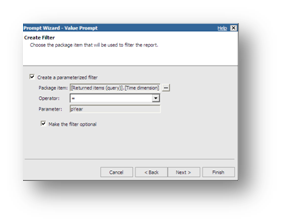
Create the following OPTIONAL parameterized filter:
Package item: “..”.
Operator: “=”.
Parameter: “pYear”.
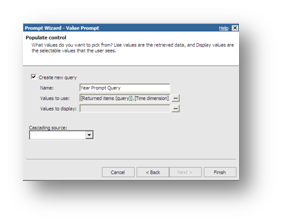
- Create a new query named “Year Prompt Query” with the following values:
Value to use: “..”.
Click Finish.
|
|
|
|
|
|
Finally, to allow our dashboard users to submit their prompt selections, we will change the prompt’s Auto-Submit property to Yes to automatically refresh the report when a selection is made.
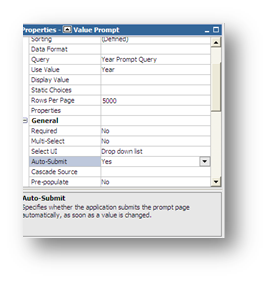
To clean up the look of our prompt page, we will add our three prompt objects inside field sets. Field sets can be found in the Toolbox tab of the Insertable Objects pane as shown below.
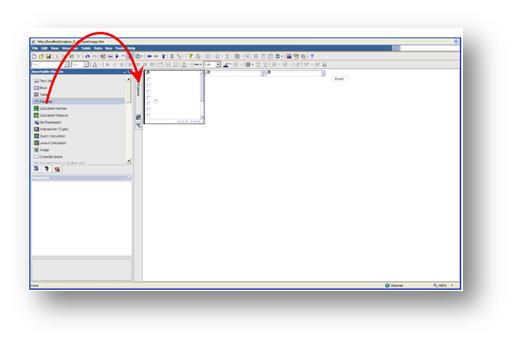
Double-click the text area of the field set and enter the following text without the double-quotes: “Select a year“. Drag the prompt inside the field set.
Save the report as “Prompt Report” in the “Global Filters” folder.
We are now ready to create the outputs for our dashboard. These will consist of one report and one chart. We will begin by creating the chart report. To do this, create a new Report Studio report using the Chart template:
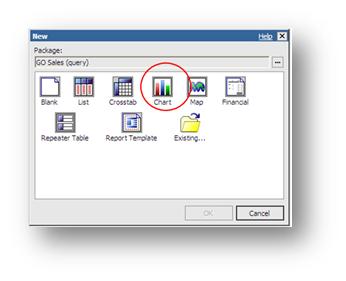
When prompted to select a chart, keep the default selection and click OK.
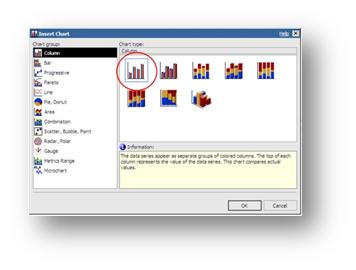
Drag the following package items to the following chart drop zones:
- Default measure: > > .
- Categories: > > .
- Series: > > .
Using the Query Explorer, select to “Query 1” create the following parameterized filter:
=?pYear?
Save your report as “Dashboard Chart” in the “Global Filters” folder.
We will now create another Report Studio report, but this time, it will be a crosstab. Click the New button in the toolbar and choose the Crosstab template.
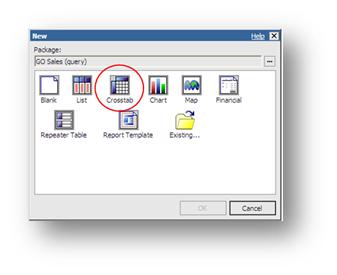
Drag the following package items to the following chart drop zones:
- Rows: > > .
- Columns: > > .
- Measure: > > .
Using the Query Explorer, select to “Query 1” create the following parameterized filter:
=?pYear?
Save your report as “Dashboard Report” in the “Global Filters” folder.
Step 2: Create the detail IBM Cognos Connection portal pages
In this step we create portal pages in IBM Cognos Connection to hold each one of the reports created in the previous step.
From Cognos Connection, navigate to the “Dashboard Pages” folder and click the New Page button as shown below.

The New page wizard starts. In the Name: box enter “Dashboard Charts Page” and click Next.
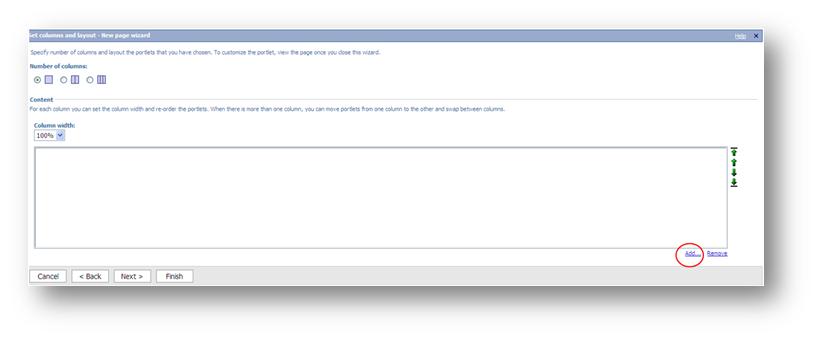
From the Set columns and layout window, keep the default number of columns and click the Add… button at the bottom to add an object to the page.
In the Select portlets (Navigate) section of the wizard, click Cognos Content in the left page and then add a Cognos Viewer object by checking it in the left pane and then clicking the Add button.
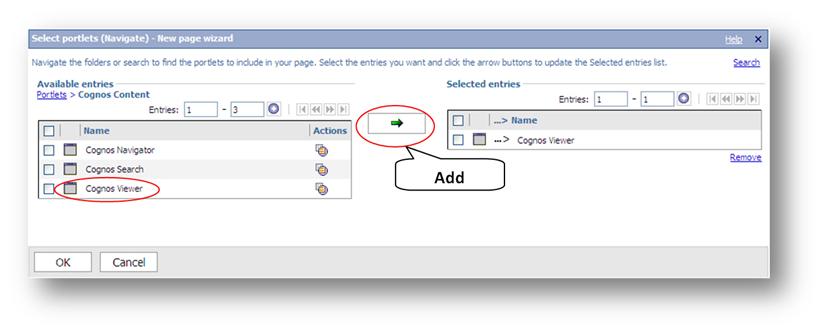
Click OK. This will return you to the “Dashboard Details” folder in Cognos Connection.
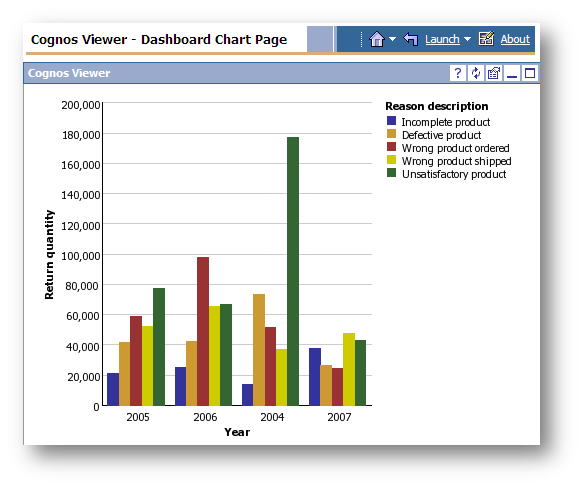
We have created the page and now have to select an entry to run in the page. To do this, click the “Dashboard Chart Page” link to run the page.
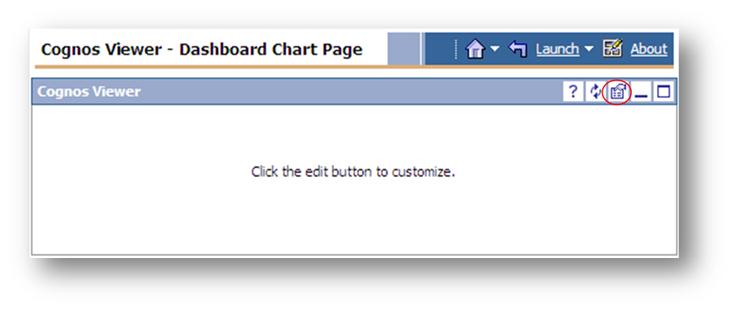
We see our empty page. To associate a report with the page, click the Properties button as shown below.
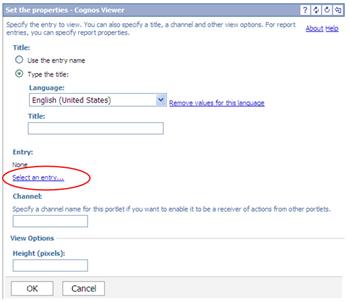
In the properties window, click the Select an entry… link.
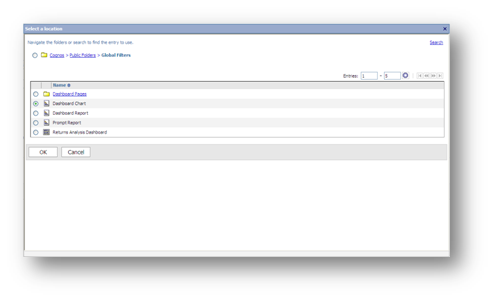
Select the “Dashboard Chart” report and click OK.
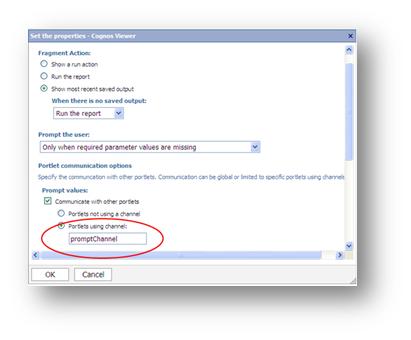
Finally, to establish communication between the various dashboard pages, click the Report Properties link. Look for the Prompt values section and enable Communicate with other portlets option. Then, select Portlets using channel: and type “promptChannel” (without the double-quotes) in the text box as shown below.
Click OK twice. The chart is displayed.
Repeat the previous steps to create the “Dashboard Report Page” that will also reside in the “Dashboard Pages” folder.


