Cognos Analytics Release 4: Most Compelling New Features
As part of the accelerated release schedule initiated with the introduction of Cognos Analytics last December, IBM made the latest release, Cognos 11.0.4 aka Cognos Analytics Release 4, available on September 16th.
While each of the previous releases have included enhancements and new functionality, Cognos Analytics Release 4 is significant enough that we wanted to present an article to our community focusing on what we feel the most compelling new features are based the time we’ve spent exploring the updated platform.
In keeping with the general theme IBM has taken with Cognos Analytics, the Release 4 enhancements focus on three main factors:
- Improved self-service
- Governance
- “Smarter” analytics
The features we will highlight fall into these broad categories.
Update: Cognos Analytics Release 5 was rolled out at the end of November 2016. You can see the features that it adds on top of what’s available in Release 4 on IBM’s website.
Dashboarding Enhancements
One of the major improvements that we talked about when Cognos Analytics initially came out was its dashboarding and visualization capabilities. These features continue to expand in Cognos Analytics Release 4, adding more self-service design options for users and flexibility around data connections. Though there’s still some ground left to cover, we think Release 4 is headed in the right direction in terms of IBM listening to feedback from users and continuing to boost usability.
Authoring against Packages
The most frequently requested enhancement according to IBM – and the one we hear most about from customers – is the ability to leverage the new visually appealing and easy-to-use dashboarding functionality included in Cognos Analytics with existing Framework Manager packages.
IBM takes a step towards this capability in Cognos Analytics Release 4, allowing users to create refreshable (more on this below) data sets on top of FM packages and then leverage those data sets in dashboards. This is a guided experience – when a user attempts to leverage a package for a dashboard, the system displays a wizard-like interface called Create Data Set. The data sets you build with this tool get stored in the content store (prior to Release 3 these were stored on disk) in Apache Parquet columnar file formats and are automatically extracted to temporary file locations on your application tier servers when requested. Depending on data volume and underlying architecture, these files have the potential to significantly improve dashboard performance.
Timed Refresh
Another advancement with R4 is the inclusion of a refresh timer for dashboards. This allows dashboards to be refreshed on a schedule. You’ll of course want to keep this schedule in sync with the refresh cycle of your underlying data sources. Dashboards can be refreshed as often as every 5 seconds. This can be a great way to immediately push new data changes to everyone’s dashboard views.
Crosstabs
For those users whose business requirements dictate a data grid approach to information delivery, crosstabs are now available as visualizations for dashboards. The functionality Cognos users are accustomed to is included, with swap rows and columns, create calculation, format, filter, and sort being just a click away. Release 4 also adds conditional formatting to Crosstabs, allowing the user to color crosstab cells based on a measure, and easily adjust and control color ranges and palettes.
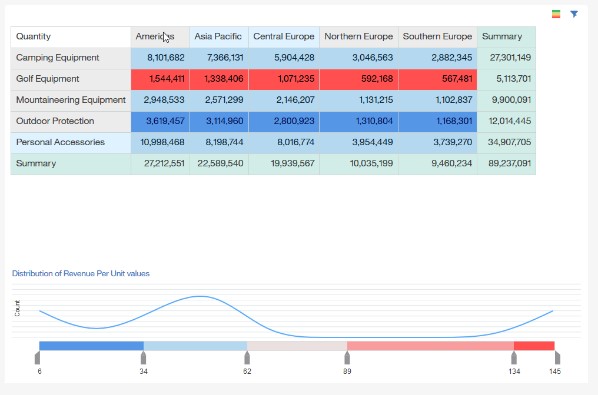
While crosstabs aren’t typically a format that’s visual or consumable enough to include in most dashboards, they can be very useful when it comes to seeing detailed results. Plus, if you add conditional coloring and tie your crosstabs to an interactive visualization showing a higher level, intuitive view of the same information, you can dynamically show the granular facts that accompany the area of the visualization users choose to select.
Storytelling
In Cognos Analytics Release 4, IBM has introduced a functionality know as Storytelling. This functionality is analogous to Tableau’s Story Point and provides a means for users to build a more structured narrative with their data.
We don’t feel that Storytelling is a comprehensive replacement for the still-supported Cognos BI for Microsoft Office component we’ve long been proponents of, but it allows for a more dynamic and interactive information delivery experience from within Cognos Analytics itself.
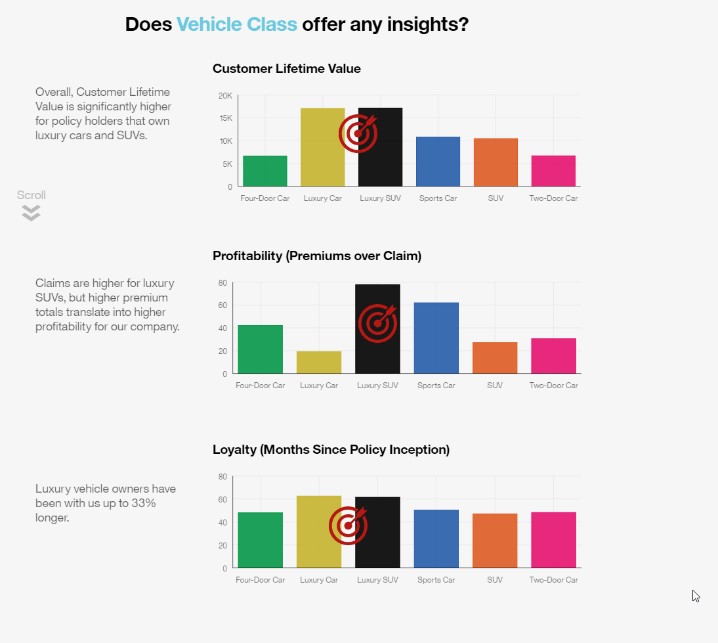
An accompanying feature that enhances Storytelling is “pinning,” where users can select specific visualizations and content for inclusion in a Story. The creation of a Story is similar to the new dashboarding functionality, where the user selects a template for displaying content, then chooses the content to place in the story, either on a single page or across multiple pages (scenes).
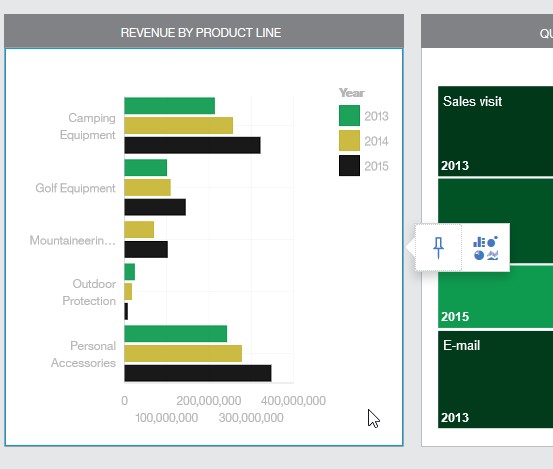
Additionally, the user has the ability to define an animation timeline that make objects (data containers, charts, annotations, etc.) appear in a specific order with a specific timing (analogous to slide transitions in Microsoft PowerPoint slideshows). This makes it very easy to present the exact views you need in sync with a report to executives or managers or share not just visualizations but also a self-contained logical path for navigating through them.
Reporting Enhancements
Beyond dashboarding, Cognos Analytics Release 4 introduces several key updates to reporting in general that positively impact both self-service and governance. The ones we highlight here add flexibility while also maintaining the strong foundation of administration that Cognos is known for.
Multi-Package Reports
While actually a Release 3 (July 2016) enhancement, we’re going to highlight this one as it’s been on many a wish list for years. The ability to author reports from multiple packages is now available; however the limitation is that a single data container (list, crosstab, chart, visualization, etc.) can only be based on a single package.
This enhancement makes Cognos more capable of producing “mashup” style results that competitors like Tableau and Domo are known for while maintaining administrative oversight. Since the information is always coming from a package, administrators can feel safe allowing users to experiment with different combinations of data sources because they know the information is all from verified assets that were intentionally designed and generated for reporting purposes.
JavaScript Support
Cognos Analytics Release 4 introduces JavaScript support in the Cognos Analytics Interactive Viewer. This is an improvement over the historical integration of JavaScript into Cognos Reports. With Release 4, you add a custom control that references your script from a file instead of embedding your script in the report itself. This approach supports easier development (allows the use of typical JavaScript development tools), re-use, and management of JavaScript functionality.
Let’s be honest, JavaScript in Cognos was always a bit of a headache. You had to hand-code the functionality you wanted or copy and paste scripts into reports from text files. This was not only time consuming but also had a negative impact from a governance standpoint because of the amount of human error that could enter the process to cause inaccuracies or broken reports. This new support feature makes a world of difference here by allowing you to smoothly attach a script. It’s faster and it supports strong governance options like having a central JavaScript repository from which analysts can pull features they want to embed in their reports.
Data Modeling Enhancements
In Cognos Analytics Release 4, several enhancements have been made to make it easier to access and prepare data for reports, dashboards, and storytelling. These improvements impact the user-targeted Data Modeling feature set within Cognos Analytics (not Framework Manager). The ones we’ve selected to discuss highlight how Cognos is getting smarter about maintaining data quality in the latest version.
Cleaning NULL Values
NULL handling functionality has been added to allow users to replace NULL values with text, numbers, or date/time values. For example, instead of nulls for a given measure, users can be presented with 0. These changes occur at the metadata layer and do not impact the underlying data. This makes it easier for NULL values to be interpreted in finalized reports so that they can add clarity instead of muddying analysis results.
Validation
Users now have the ability to validate any data element they add to a data module. Upon discovering an error, users are presented with descriptions of those errors and corrective actions in a new Validation Tray. This makes a big impact on the speed with which someone can fix an issue in a report. Rather than searching for some obscure error code, you can now get instructions on problems you see during development.
Data Set Refresh
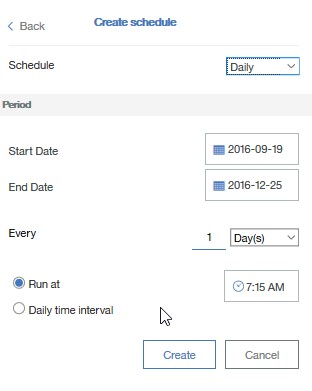
As mentioned previously, users have the ability to create data sets from data modules or FM packages and set them to refresh on a schedule. This scheduling includes all the typical time grains (weekly, daily, hourly, etc.) as well as a by trigger option for specific events. This aligns with the dashboard syncing strategy we discussed earlier, and adds to Cognos’s ability to smartly adjust when important data changes come through.
Administration Enhancements
Cognos Analytics Release 4 also continues to improve upon the already strong administrative capabilities of the platform. The enhancements here are mainly around smarter management of future Cognos releases and report migrations.
“Over the Top” Releases
Starting with Release 4 moving forward, total cost of ownership is reduced with support for “over the top” installs. This approach to installs maps to the accelerated release schedule for Cognos Analytics (releases every 2-3 months), provides for continuous delivery of enhancements and fixes, and preserves settings and configurations. Customized content (custom logos, branding, etc.) will still need to be backed up and restored separately.
LifeCycle Manager
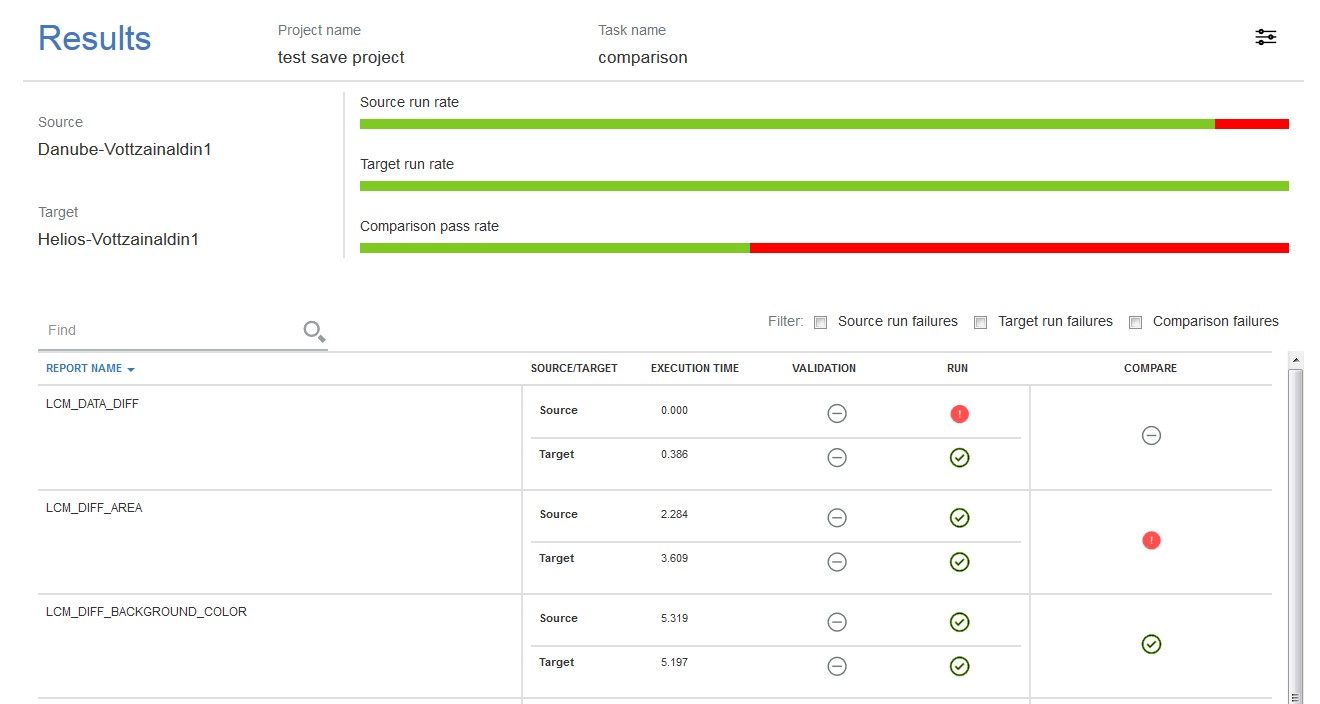
We have traditionally used LifeCycle Manager as part of our proven practices approach to validate and compare reports as part of Cognos migrations.
Cognos Analytics Release 4 brings several improvements to this helpful tool, including:
- Thresholds and Properties for Report Validations: This allows the user to adjust the level of validation that occurs when comparing reports. For example, if pixel perfection is not required, that property can be disabled.
- Validation of CDM to DQM Migrations: This functionality allows legacy Cognos Query Mode reports to be run in Dynamic Query mode to understand if they’ll migrate seamlessly or if remediation needs to be performed.
- Performance Comparisons: This functionality allows you to gain insights into differences in performance across the existing and to be environments.
Conclusion: Beyond Cognos Analytics Release 4
In summary, IBM continues to enhance Cognos Analytics with compelling features that span the breadth of Gartner’s definition of bimodal analytics – focusing on the self-service and ease of use capabilities of mode 2 while continuing to support the governance and enterprise reporting capabilities of mode 1.
While the user interface changes delivered in Cognos Analytics can be a source of concern, we’ve found that users adapt without significant effort and that the new features and functionality more than offset any hesitation to make the switch.
If you’re still on the fence about switching to Cognos Analytics, we’d like to point out that with the Release 4 announcement, IBM also announced April 30th, 2018 as the official End-of-Support date for Cognos BI 10.2.x. For anyone still unsure about upgrading to Cognos Analytics or concerned that it’s tantamount to burning your v10.2.x ships on the beach, this announcement makes it clear that it’s time to start collecting the firewood.
Ironside has guided many clients through successful migrations since the initial release of Cognos Analytics, and we can help you make a clean transition no matter what stage of the decision process you’re at. Let us know how we can be of help.


