Ironside Tech Tip: Monitoring Your Cognos Analytics Environment
Maintaining system availability is an important aspect of every Cognos Analytics administrator’s job. Monitoring your Cognos Analytics environment is a key part of maintaining this availability. You’re likely already monitoring the IBM Cognos service for Start/Stopped status, but this doesn’t always give an accurate representation of what’s going on with your servers. Often times, a user will report that Cognos isn’t available but the service is running. What else can you do? Fortunately, Cognos Analytics provides some informative URLs you can use to check the status of your content managers and dispatchers.
Checking the Content Managers
Determining if your content managers are online is as simple as accessing http://{CognosAnalyticsServer}:{Port}/p2pd/servlet. Whether you’re performing system maintenance or have received reports that Cognos is unavailable, sometimes you need to check if your content managers are online and identify which content manager is active and which are in standby.
Manually Check the Content Managers
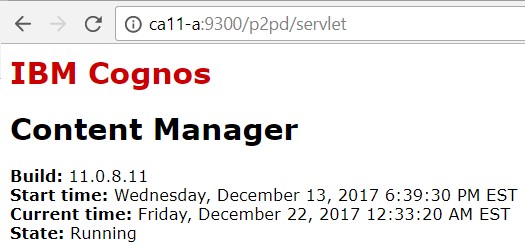
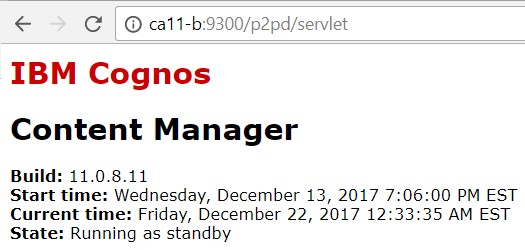
You can manually check the status of your content managers by accessing the URL above in a browser, changing the host and port for each of your content managers as needed. The Primary Content Manager will show a state of “Running” while the Standby Content Manager will show a state of “Running as standby” as shown below.
Primary
Standby
Automatically Check the Content Managers
While you may occasionally have a need to manually check your content managers, wouldn’t it be nice to automate this check instead? PowerShell offers a way to automate this check. Let’s walk through the process.
Using the Invoke-WebRequest command, we can query the URL and parse its output.
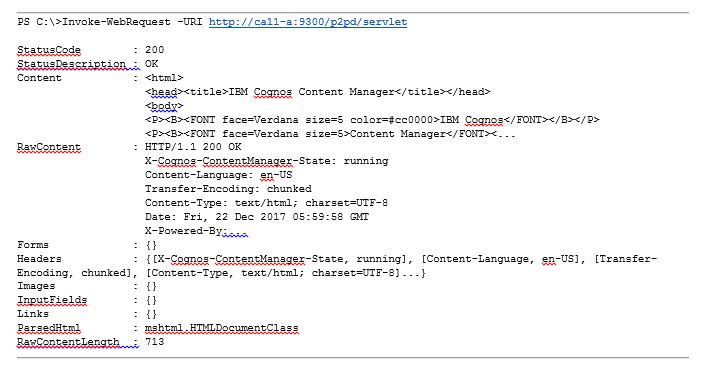
That’s nice, but it would be nicer to just see the status. Let’s take a closer look at the headers.

Now let’s dig into X-Cognos-ContentManager-State header and check each Content Manager:
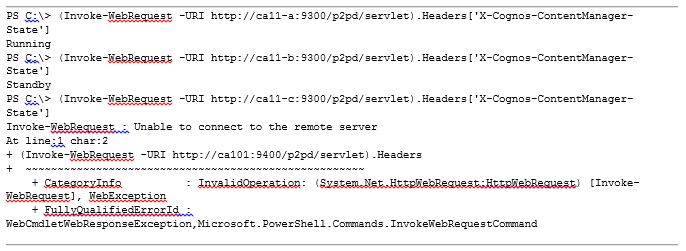
What happened to the Content Manager on ca11-c? Fortunately, ca11-c doesn’t exist. But if it did, we now know it’s offline and needs to be investigated.
Putting It All Together
We now have the tools to check each Content Manager and report on its status. Adding a try/catch loop and a switch statement lets us test and report on the status of each CM. We can save this as ContentManagerCheck.ps1 and schedule it to run on a regular basis.
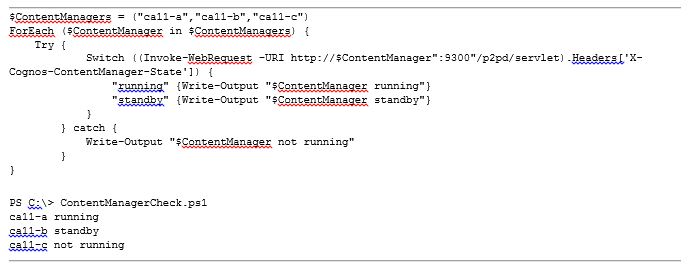
You can enhance this script by having it email you when a CM is “not running” or log its output and allow your IT team to integrate it into their existing monitoring system.
Checking the Dispatchers
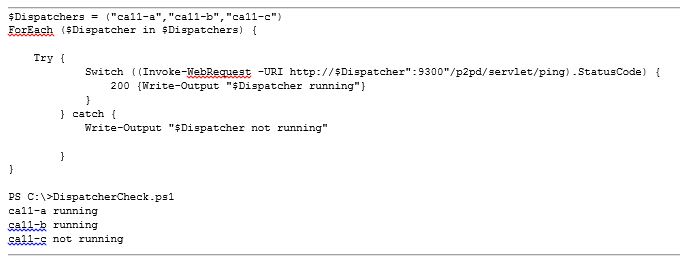
You can use the same process to determine if your Dispatchers are online. Cognos provides a health check page intended to be used by load balancers to check the availability of the dispatchers. The URI to access for the dispatchers is http://{CognosAnalyticsServer}:{Port}/p2pd/servlet/ping.
Here, instead of looking for the contents of a header, we’re simply checking that the 200 Status code is returned, indicating that the dispatcher is responding to HTTP requests.
Conclusion
The commands and scripts here can serve as a strong foundation to add additional monitoring to your Cognos Analytics environment. While PowerShell was used in these examples, the concepts can be applied to other scripting languages or directly integrated with the system monitoring you might already be using.
About Ironside
Ironside was founded in 1999 as an enterprise data and analytics solution provider and system integrator. Our clients hire us to acquire, enrich and measure their data so they can make smarter, better decisions about their business. No matter your industry or specific business challenges, Ironside has the experience, perspective and agility to help transform your analytic environment.


