Building Effective IBM Cognos Active Reports: Part 3
Part 1 of Building Effective IBM Cognos Active Reports, described Active Report variables, connections, and how they work together to make dynamic content possible in Cognos 10 Active Reports. Part 2 began a discussion of static controls and how to make larger changes to an Active Report display. This article, Part 3, continues that discussion with navigating back from detail pages, animation, and more on combining static and data controls. (If you haven’t read Part 2 yet, please do – the example drill through report started in that article is used in this one as well.)
Getting Back
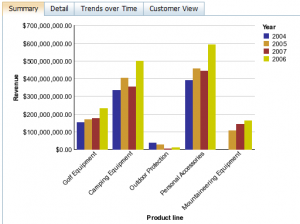
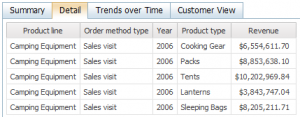
Static decks do not display any navigation controls by default, so there is no built-in way to move between cards. In a drill through report, such as the example from Part 2, clicking on the chart provides navigation from the summary card to the detail card, but there is no way to get back to the summary.
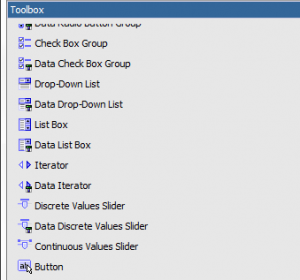
There are several ways to create this “go back” type of navigation. The simplest is to add an Active Report button (just called a button in Report Studio, but not the same as an HTML button or a prompt button).
When a button in an Active Report is clicked, it can – like any Active Report aware object – set Active Report variables. This is how Active Report works: whenever a variable changes, Cognos automatically updates all of the objects affected by that variable. In this case, the button should set the card control variable to the value for the summary card. As soon as that variable is changed, the summary card will be selected and displayed.
(Reminder: the card control variable is an unofficial term for an Active Report variable that is used by a static deck to control which card is displayed. The deck is set to select a card based on the value of that variable – setting the variable will change what is displayed on the screen.)
There are other ways to change the display of an Active Report. As an Active Report gets more complicated, it may make sense to use static tab controls instead of decks, or to place a button bar at the top of the screen. A tab control permits direct navigation between tabs at all times by clicking. A button bar can be used to achieve the same effect by configuring the bar to set the card control variable based on the button clicked. The advantage of using a button bar is that the report author has more control over which cards can be navigated to directly – the tab control has to display every tab, while the button bar can include as many or as few as needed. Often, detail screens should not be reachable except through a “drill through” action.
Animation
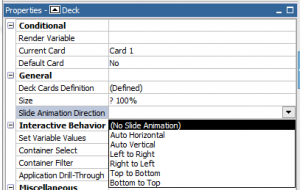
Decks (and Data Decks) have a Slide Animation Direction property that can be used to liven up Active Reports.
The property causes transitions between cards to be animated: the new card “slides in” from off-screen over the old card. The animation can come from any of the four screen edges. There are also “automatic” horizontal and vertical options: in this case, the animation direction will vary depending on whether the new card is before or after the old card in the deck order. These animations are quick and can help visualize the transition from one type of data to another.
In order for the animation to look its best, the size of the card before and after the transition needs to be the same. If this is not the case, the animation may stutter or not animate properly.
Next Up – Combining Data and Static Controls
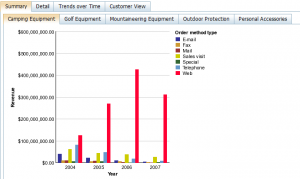
One of the powerful features of Active Report is that deck and tab controls can be nested inside each other. For example, the summary card of an Active Report can contain a data tab control that lets the user switch between multiple charts (one chart per product line, for example). The detail card can still be a single list control – so long as Product line is one of the fields on the list, the list control can be set up to filter both on Product line and on the field clicked on in the chart. This lets a single control serve as a drill detail for multiple source charts, which will keep the size of the Active Report down and thus improve load time and performance. This requires a few extra steps – master/detail relationships, extra data items in the query – that will be described in Part 4 of this series.


