Performing Data Warehouse Validation with IBM Cognos Report Studio
Reporting should start with a “single source of truth” and end with a “single version of truth.” Delivery of accurate reporting information is paramount in the day-to-day operations of every organization. Some of the methods for maintaining data Integrity (within the data warehouse) would be to apply referential integrity and maintain primary keys on tables. In addition, associated ETL processes can utilize checksums, or record counts, when loading the warehouse. Once the data is in the warehouse, the next step would be to model the data for exposure to the end-users.
Models can easily become extremely complex and the accuracy of the reporting MUST be ensured for your end-user community. One source of truth, one version of truth, and overall trust in the data is crucial for the long-term success of your warehouse. So, is there an optimal method to proactively determine the accuracy of the model and the data being reported? Unfortunately, there is no “out of the box” solution, but a capable Report Studio user can easily build a report to ensure general data quality of the IBM Cognos model. The outline below represents the steps for building the appropriate queries with a visual diagram representing two facts being evaluated.
1. Build a Fact Query
- Sub-Category = ‘Fact’.
- Fact Count = Count (or sum) a metric in your fact.
2. Build a Dimension Query – Line of Business Dimension
- Sub-Category = Case When any field in dimension = ‘X’ Then ‘LOB’ Else ‘LOB’ End.
Note: This fill forces a join to the dimension being evaluated for integrity.
- Fact Count = Count the exact same metric from your fact query.
3. Repeat step 2 (Build dimension queries) for each dimension in your model by modifying the Sub-Category to reflect the dimension being evaluated.
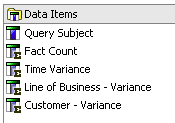
Your data items for each of these queries should appear as follows:
4. Union the results from the above step.
5. In the resulting query from step 4, utilize case statements and a list report (as opposed to a crosstab) to allow more control of my desired output (as outlined below):
- Query Subject = ‘Name of Your Fact being Evaluated’.
- Fact Count = Case When Sub-Category = ‘Fact’ Then Metric Else 0 End.
- Time Variance = Case When Sub-Category = ‘Fact’ Then Metric
When Sub-Category = ‘Time’ Then (Metric * -1)
Else 0
End
- Repeat step c for each Sub-Category in your union (remember to modify the dimension being evaluated in each case statement).
6. Repeat step 5 for each fact being evaluated.
7. If more than one fact is being evaluated, union all the unions created in step 4.
Your data items for the union would look similar to the screenshot below:
8. Create a list report with all the data items created in the above steps.
The ultimate goal is to have a report that counts the exact number of records in your fact table and each dimension column, from the list report, with a value of 0. A 0 value indicates model referential integrity has been validated and thus no records are dropping from reporting.
The above technique utilizes a life-to-date approach for all records in the warehouse. A prompt page with date filters can easily be applied to this solution. Historical data can unexpectedly and unknowingly be altered and thus I have used the following approach for scheduling reconciliations after the latest data has been loaded to the warehouse:
- Business Days – Report runs form the past seven calendar days.
- Saturday – Report runs a year-to-date reconciliation.
- Sunday – Report runs a life-to-date reconciliation.


