What’s New in Cognos 10.2.2: The Top 10 Features You Need to Know
To learn more about Cognos Analytics, the next-generation Cognos platform that IBM announced at Insight 2015, please check out our article on the product’s top 4 release features.
Update, October 6, 2015: Cognos 10.2.2 has been around for almost a year now, and we’ve had a lot of time to dig deeper into the features we discussed originally in this article. To keep you informed on what we’ve found out, this post’s original author Crystal Meyers has gone back and added new reflections and insights she’s gained while working with 10.2.2 in the field. Check out her new thoughts in italics below.
On October 7th, IBM announced Cognos 10.2.2 will be released on November 21, 2014. Cognos 10.2.2 boasts many exciting new features that will enhance the end user experience and ease of use by simplifying functionality; allow for quicker, easier deployments leading to faster time to value, and improve general data access and administrative functions to make management of the tool more efficient.
Below are the top ten new features of Cognos 10.2.2 that you need to know about.
10. Templates and Style References
Templates and Style References are available in both Report Studio and Workspace Advanced. A template is a report without metadata from which other reports can be created against any package in order to expedite and standardize the development process. When creating a report from a template, the report author can either select an actual template to use or another regular report. If a regular report is selected, that report will be converted to a template (the metadata will be removed) first.
The ability to leverage report templates or even existing reports as templates can lead to a significant reduction in development time for new reports. A great use case for these templates is to use them to enable self-service reporting by having a set of predefined templates available for power users to select from and use those as a starting point for their report development.
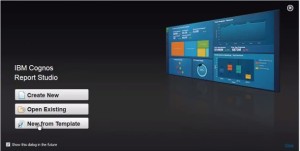 Fig 1a. Report Studio Welcome screen with option to create a new report from template
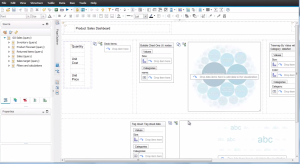 Fig 1b. Report template in Report Studio with no metadata
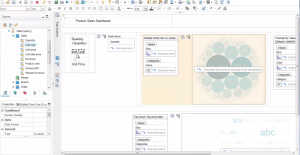 Fig 1c. Report template in Report Studio with new metadata added
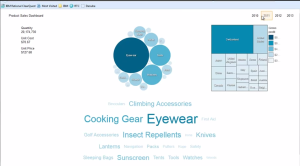 Fig 1d. Output of report created using template
Style References allow reports to leverage local and global classes from other reports in order to simplify formatting and maintain consistent standards across reports. Style References are accessed via the Tools menu.
Style References can make formatting, which is often the most time consuming part of Cognos Report Development, much easier and faster by allowing the author to use pre-defined styles to format their report objects. In addition to reducing development time and thus speeding up time to delivery, style references can also help make reports look consistent with one another across departments, lines of business, or even entire organizations.
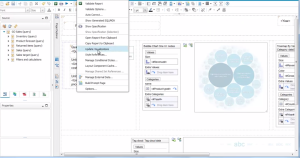 Fig 1e. Where to find Style References in the Toolbar
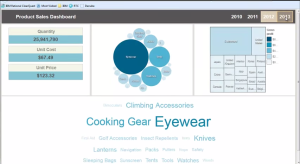 Fig 1f. Output of report created using template after applying Style References
9. Tabbed Report Output
Cognos 10.2.2. offers new Report Properties in Report Studio that allow the report author to specify whether report pages should function as pages or as tabs in the report output. When the ‘View Pages as Tabs’ setting is utilized, report pages will show up as interactive tabs in HTML output and individual worksheets in Excel output. This new property provides an easy way for the report author to establish this popular report output look and feel that previously could only be accomplished by extensive formatting.
Previously, tabbed report views were standard with Cognos Workspace and Active Reports; however in order to accomplish the same look and feel using a Report Studio report, custom formatting and coding needed to be applied, which was not only time consuming but also restrictive for some organizations who chose not to allow custom code in Report Studio reports. The introduction of the tabbed view in Report Studio allows developers to choose whichever development method is most appropriate for their particular use case without needing to consider the added challenge of formatting for dashboards or other reports that require a tabbed view.
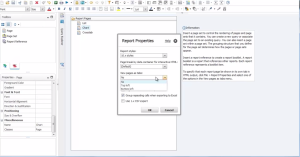 Fig 2a. New ‘View Pages as Tabs’ Property in Report Studio
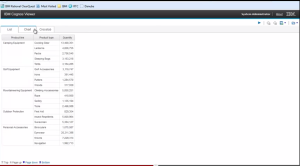 Fig 2b. Report Output with Pages displayed as Tabs
8. Dynamic Cubes Hardware Sizing Wizard
The Hardware Sizing wizard helps take the guesswork out of allocating memory, CPU, and hard disk to your dynamic cubes. Simply right click on your cube to open the Input Dialog where you will enter information about your cube, such as the number of users, members, and attributes. As soon as values are entered, the hardware requirements are immediately updated to provide information on the hardware and memory requirements for the cube as well as a breakdown of the memory required for each cache instance.
Prior to the Hardware Sizing wizard, Cognos administrators did not have a way to validate their sizing requirements before implementing a dynamic cube, so optimized sizing always involved a bit of trial and error. Ensuring that allocated resources are enough to support the required cubes but not excessive (and therefore leading to additional, unnecessary cost) is a critical aspect of a successful deployment, and this functionality allows you to make sure that happens before the cube goes into service instead of taking a guess.
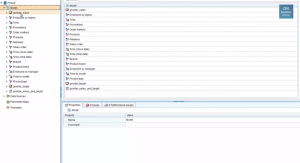 Fig 3a. Opening the Hardware Sizing Wizard
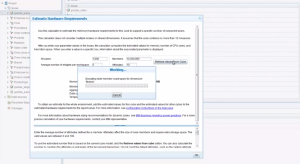 Fig 3b. The Hardware Sizing Wizard input screen
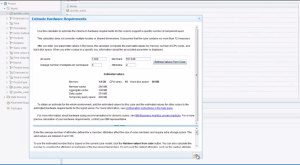 Fig 3c. The Hardware Sizing Wizard output
7. Active Report Live Preview
With the new Active Report live preview feature within Report Studio, you no longer have to download an MHT file every time you want to view and test and Active Report. You can now preview your report directly from Report Studio with the click of a button. You can even make changes directly to the report output, seeing results immediately, and those changes will be written back to the report itself. This is bound to reduce development and testing time significantly as well as improve the overall experience for the report author.
The Active Report live preview feature is an incredible time saver in the Active Report development process. Without the preview option, every change to the report, from formatting to query logic to adding objects or relationships, required the report to be run in order to be tested. Changes would then be made and then the report would be run again. Depending on the size of the report, this could be a very time consuming process. With the preview feature, Active Report developers can now see how their changes look in near real time without needing to run the report. The added benefit of being able to modify the report layout directly from the preview means that there is no longer a need to flip back between screens to identify and track changes to be made, or to run the report after each change. This allows the development process in Cognos 10.2.2 to be less iterative and changes to be made much more quickly, decreasing overall time to insight.
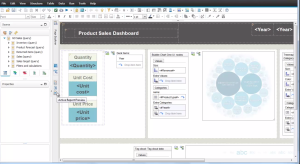 Fig 4a. Active Report Preview Button in Report Studio
6. My Data Sets
The new My Data Sets feature allows users to do more robust analyses of data that lives outside of a Cognos framework model or cube. This feature allows end users to import their own Excel or text files, which are turned into Cognos packages that the user can then use for analysis or reporting.
My Data Sets differs from the current External Data feature in three main ways. First, with My Data Sets, much higher volumes of Excel and text data can be imported. Second, this data now persists on the Cognos server for as long as the user or administrator specifies. Finally, rather than being incorporated into an existing Cognos package, My Data Sets are created as standalone packages.
My Data Sets can be launched through the Welcome screen directly or from the ‘My Area’ section of Cognos Connection.
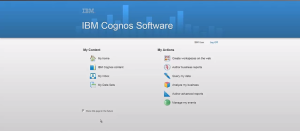 Fig 5a. Launching My Data Sets from the Cognos Welcome Screen
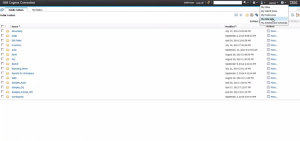 Fig 5b. Launching My Data Sets from Cognos Connection
 Fig 5c. Browsing for a file to import in My Data Sets
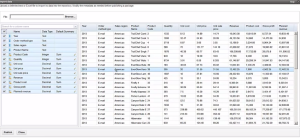 Fig 5d. Updating Metadata for My Data Sets
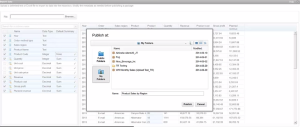 Fig 5e. Publishing My Data Sets as a Cognos package
While this feature does offer end users much flexibility in importing and reporting off of their own data, Administrators maintain the ability to manage all My Data Sets content. All imported data sets can be viewed under the Data Sets section of the Status Tab in Cognos Administration, along with relevant information about the Data Set, such as owner, file size, number of rows, tenant, and last refresh date. Administrators can also delete data sets from this section. My Data Sets permissions are controlled via the ‘My Data Sets’ capability under the Capabilities section of the Security tab. Modifying these permissions allows administrators to restrict the My Data Set functionality if desired, or to limit it to a certain subset of Cognos users. Settings for maximum file sizes and the number of files that each user can upload are also controlled by the Cognos Administrator.
As mentioned in the original article, My Data Sets provides a way for Cognos 10.2.2 power users to author reports or perform analyses against data that is not incorporated into an existing Cognos package. While more powerful than the existing External Data feature in terms of the volume and types of data that can be loaded, My Data Sets does not completely replace this feature, as there are still use cases for both, especially when external data needs to be combined with data that already exists in a Cognos package. You should compare these two features to find out which one works best for your situation.
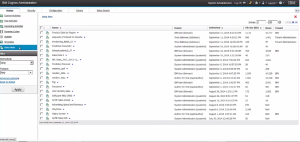 Fig 5f. My Data Sets in Cognos Administration
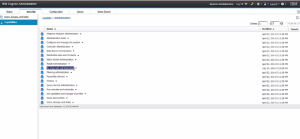 Fig 5g. The My Data Sets Capability
5. Extensible Visualization Enhancements
New Extensible Visualizations
With the announcement of Cognos 10.2.2, three new extensible visualizations have been added to AnalyticsZone.com for download. The new visualizations are a Chord chart, which visualizes relationships between categories by the thickness of the line between the categories; a Combination chart, which allows for both a bar and line chart, leveraging different axes, to be displayed on the same visual; and a Tornado chart, which is a bar chart where categories are listed vertically, typically with two metrics to be compared to one another.
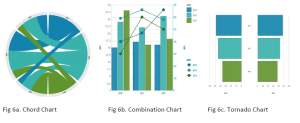 Extensible Visualization Properties
Report Studio now provides a framework for modifying extensible visualization properties, giving report authors much greater control over the look and feel of the visual without having to customize or create a new one. Properties that can be modified include things like Chart Title, Legend, Axes, and Font.
Optional Categories
Additionally, optional category fields now provide the ability to use an extensible visualization without inserting data items in all of the category drop zones. This ability provides more flexibility for report authors in the use of these visualizations.
Converting Extensible Visualizations
Finally, now with just a right click, report authors can convert extensible visualizations from one type to another, allowing them to modify chart types in the report without re-authoring the entire visualization.
In addition to the three new visualizations noted above, the Dynamic Map is an additional new RAVE visualization that has been added since the release of Cognos 10.2.2. This visualization allows you to present data geographically as a color gradient on a map and automatically adjusts the region that is displayed based on the data being used.
4. Cube Designer Enhancements
A couple of new features in Cube Designer will give data modelers more efficient ways to set up new Dynamic Cubes or add dimensions to existing ones.
Custom Relative Time
The new Custom Relative Time ability allows the modeler to establish custom relative time members in Cube Designer using the same properties available in Transformer. There are three different kinds of members that can created – Single Period Relative Time Member, Period to Date Time Member, and Custom N-Period Running Total Definition Time Member. The properties for each of these kinds of members are unique so that the member can be completely customized.
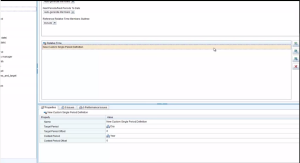 Figure 7a. Single Period Relative Time Member Properties
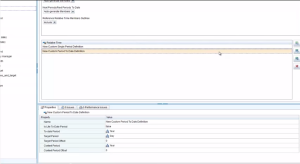 Figure 7b. Custom Period to Date Time Member Properties
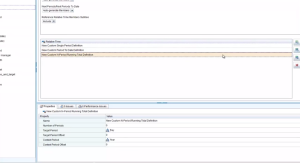 Figure 7c. Custom N-Period Running Total Definition Time Member Properties
Import Framework Model Metadata to Cube Designer
Another new feature in Cube Designer is the ability to import Framework Manager Metadata directly and use it as the basis for a Dynamic Cube. Once metadata has been imported into Cube Designer, query subjects can be imported into the Cube Designer project as dimensions. These dimensions can then be edited to add the hierarchies and levels required for that dimensions.
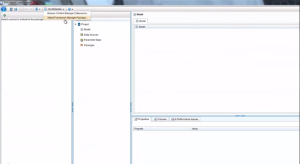 Fig 7d. Importing Framework Model Metadata into Cube Designer
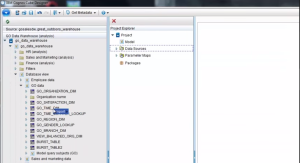 Fig 7e. Importing Query Subjects into Cube Designer Project
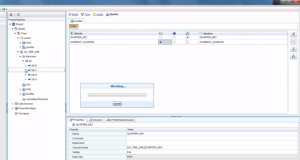 Fig 7f. Editing levels and hierarchies in the imported dimension
With the increasing adoption of Cognos Dynamic Cubes, new features and functionality related to the Cube Designer tool are always of significant value. Cognos 10.2.2’s ability to import Framework Manager model metadata into Cube Designer has proven to be incredibly useful as a way for organizations struggling with performance issues to easily convert existing relational models to Dynamic Cubes.
3. In Memory Aggregates
Enhancements to In Memory Aggregates for Dynamic Cubes are also a key feature of this new Cognos release.
User Defined In Memory Aggregates
User Defined In Memory Aggregates allow the Cognos administrator to define new aggregates manually, rather than relying solely on what the Aggregate Advisor recommends. On the aggregate tab of each cube, there is now a new User Defined Aggregate section where you can define the aggregate, which measures and dimensions to include, and the levels of aggregation for each dimension in the aggregate.
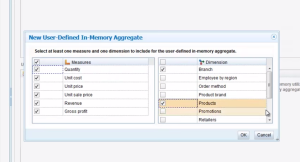 Fig 8a. User Defined In Memory Aggregate Editor
Autonomic Optimization of In Memory Aggregates
Enabling autonomic optimization of in memory aggregates on a dynamic cube will allow the cube to periodically run a limited version of the Aggregate Advisor in the background while the cube is running. This, in essence, makes the cube self-optimizing, and is particularly useful when usage patterns or data volumes are expected to change over time. Autonomic Optimization can be enabled for any dynamic cube by checking a single box on the cube properties sheet.
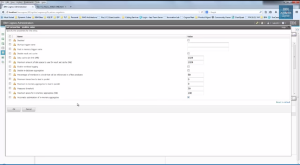 Fig 8b. Enabling Autonomic Optimization for Dynamic Cubes
2. Framework Manager Enhancements
Many updates have been made to Framework Manager to make modeling of data more efficient and optimize the performance of queries.
Bridge Query Subjects
Previously when a bridge table was used in a Cognos Framework Model, it could only be modeled using a many to many relationship. Since many to many relationships are not supported in DQM, bridge table use was limited to CQM. Also, many to many relationships used in this context were often found to produce incorrect or unexpected results. The new Bridge Query Subject in Framework Manager allows the modeler to now simply set the usage property of a query subject to ‘Bridge’ while maintaining a one to many relationship and Cognos will identify this as a bridge table rather than a fact table.
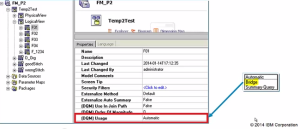 Fig 9a. New Bridge Query Subject Property in Framework Manager
Filter Join Optimization
This new feature allows Cognos to filter one side of a join using the values retrieved by the other side. This minimized the volume of data retrieved by the BI Server, particularly when working with multiple data sources or when one side of the join has significantly more rows than the other side. Report performance can be markedly improved using this feature. In fact, it has shown increases in performance up to 100 times in IBM Lab testing.
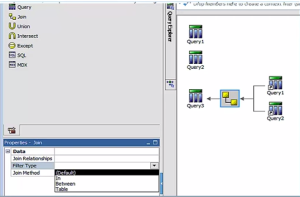 Fig 9b. Filter Join Optimization in Framework Manager – Join Methods
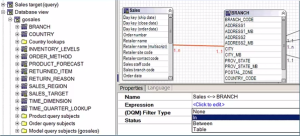 Fig 9c. Filter Join Optimization in Framework Manager – Filter Types
Parameter Map Refresh
The new parameter map refresh features in Cognos 10.2.2 now gives Cognos Administrators the ability to control how often parameter map values are refreshed. Where these values were previously cached for the duration of a user’s session, now you can specify down to the second, how long the values will be cached. Setting the value to 0 will retrieve parameter map values every time report is run, while values of 1 or more will only refresh the cache if that number of seconds has passed since the last time the user ran the report. Another useful application of the parameter map refresh is the use of macros to specify different refresh values for different users, groups, or roles.
Summary Query Subjects
New Summary Query Subjects in Framework Manager allow you to specify grouping and aggregation in the framework model query subject in ways that could previously only be accomplished in the query design itself within Report Studio or Workspace Advanced. This allows for a more user friendly experience, as report authors and analysts no longer have to apply complex aggregation logic in reports, they can just drag and drop from the Query Subject and the summarized data is reusable and consistent across reports. This also allows for model filters to be applied after aggregation if desired.
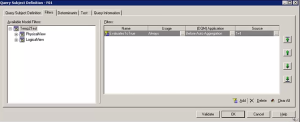 Fig 9d. Summary Query Subjects in Framework Manager
1. User Interface Profiles
Perhaps the most exciting new feature in Cognos 10.2.2 is the ability to now create custom User Interface Profiles. This tool allows administrators to customize the UI elements and default behaviors for each studio in Cognos. Once enabled, administrators will see the User Interface Profiles section under the Library tab.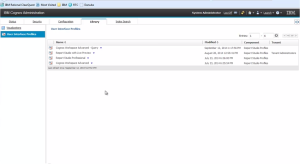 Fig 10a. Custom Interface Profiles section in Cognos Administration
While the out of the box Report Studio Professional and Cognos Workspace Advanced profiles cannot be modified (so that you always have the default versions available), they can be copied and the copy can be edited. Right clicking on the profile and selecting edit opens the Profile Editor. In the editor, you can customize almost any element of the studio, including toolbars, explorers, toolbox objects, and many more. You can also edit default behaviors, such as which type of package tree is displayed by default when opening the studio.
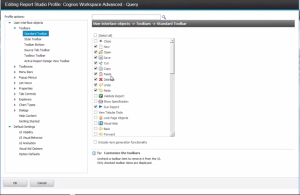 Fig 10b. User Interface Profiles Editor – Customization of UI Elements
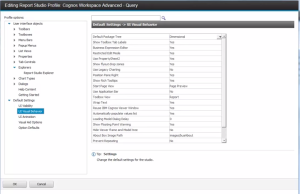 Fig 10c. User Interface Profiles Editor – Default Behaviors
This is truly a tool that will allow organizations to customize the functionality of each Studio to different users’ needs, skills, and comfort level with the technology, resulting in an optimal self-service business intelligence practice.
The ability to customize the tools and functionality of each Cognos 10.2.2 Studio to a particular user or group’s needs has proven to be a critical component in the success of implementing self-service and allowing users to create the content that they need independently rather than requiring them to go through an IT department or central reporting team. With User Interface Profiles, each studio can be customized to meet the needs of a particular user group, rather than requiring them to adapt to a tool that may either be too limited for what they need to accomplish or too complex to be intuitive. It is also a great way for users to grow their knowledge base and experience with Cognos by allowing for new features to be unlocked as users become comfortable with the environment and existing functionality.
Summary: Next Steps for Cognos 10.2.2
These 10 features, or groups of features, listed in this article are not a comprehensive list of all of the new features of Cognos 10.2.2. There are several additional enhancements designed to improve the self-service experience and ease the tasks related to maintenance and administration. For a full list of Cognos 10.2.2 new and deprecated features, look for the upcoming Cognos 10.2.2 User Guide, or contact Ironside for more information.
You can also view dozens of videos that highlight the new features discussed in this article as well as many others.


