If you rely solely on a data warehouse as your repository,  you have to put all your data in the warehouse–regardless of how valuable it is. Updating a data warehouse is more costly. It also takes a lot of time and effort, which usually leads to long delays between requests being made and fulfilled. Analytics users may turn to other, less efficient means to get their work done.

If you rely solely on a data lake, you have the opposite problem: all the data is there, but it can be very hard to find and transform it into a format useful for analytics. The data lake drastically reduces the cost to ingest data, but does not address issues such as data quality, alignment with related data, and transformation into more valuable formats. High value data may reside here but not get used.

When you have a system of repositories with different levels of structure and analysis, and a value-based approach for assigning data to those repositories, you can invest more refinement and analytics resources in higher-value data.

Striking the right balance between refinement and analytics is key. Performing analytics on unrefined data is a more costly, time-consuming process. When you can identify value upfront, you can invest in refining your high-value data, making analytics a faster, more cost-efficient process. 

Our value-based approach can help deliver higher ROI from all your data.

A picture containing diagram

Description automatically generated

This value-based approach also helps your modern analytics framework better meet the needs of your knowledge workers. For example, analysts can jump into complex analysis, rightly assuming that high-value data is always up to date. In addition, automated value delivery automatically distributes high-value data in ways users can act on. 

Let’s invest in a conversation.

We want to hear about your current framework and your changing needs. 

Schedule a time with Geoff Speare, our practice director:

Geoff’s Calendar
GSpeare@IronsideGroup.com
O 781-652-5758  |  484-553-1814

Get our comprehensive guide.

Learn about our proven, streamlined approach to taking your current analytics framework from where it is to where it needs to be, for less cost and in less time than you might imagine.

Download the eBook now

Check out the rest of the series.

Today’s companies have no shortage of data. In fact, they have more than ever before. And they know that, hiding in that data, are insights for better business decisions and competitive superiority. 

But even with all the investments they’ve already made, in everything from data marts and warehouses to operational data stores, companies suspect the most valuable insights may remain hidden. And they’re often right. If your current analytics framework is no longer meeting your needs, the signs are all around you.

Top indicators that it’s time to evolve your current framework

  1. Frustrated users can’t find the data or insights they need to drive better decision making. 
  2. Users rely on self-created spreadsheets not accessible to others. 
  3. Analysts spend more time on manual updates than on actionable insights. 
  4. IT-owned analytic assets take too long to update, reducing their usefulness. 
  5. High cost to manage data curtails innovation. 
  6. Your framework is already overwhelmed by the data sources you have, leaving no room for new ones. 
  7. Value leakage — in the form of data you aren’t acting on — grows every day.

So, what’s stopping you?

In working with companies across virtually all major industries, we’ve encountered just about every obstacle that keeps companies trapped in a data analytics environment that no longer meets their needs. Here are the most common concerns we hear, and how Ironside helps to address them.

“We can’t walk away from the investment we’ve already made in our current framework.”

We get that. It’s why a core part of our approach involves meeting you where you are, and helping you move forward from there – not from the starting line. You keep what you have and invest in ways that will give you the greatest ROI based on your needs.

“We don’t have the budget for a big increase in analytics spending.”

We find that a lot of companies actually spend more than they need to by treating all their data equally. It all goes to the data warehouse, where processing costs are high. With our value-based approach, you could end up reducing your spend. 

“We don’t have the time or resources to take this on right now.”

We can function as an add-on to your existing team, so that they won’t be overwhelmed by even more to do. Plus, the new architecture could drastically reduce manual tasks that are taking up their time—freeing them up to focus more on generating game-changing insights.

Three framework components will help you reach new levels of data analytics.

Diagram

Description automatically generated

Let’s make time for a conversation.

We want to hear about your current framework and your changing needs. 

Schedule a time with Geoff Speare, our practice director:

Geoff’s Calendar
GSpeare@IronsideGroup.com
O 781-652-5758  |  M 484-553-1814

Get our comprehensive guide.

Learn about our proven, streamlined approach to taking your current analytics framework from where it is to where it needs to be, for less cost and in less time than you might imagine.
Download the eBook now

Check out the rest of the series.

Looking back now that we’ve reached the one year anniversary of the Take30, we appreciated the opportunity to share our perspective on a range of Business Intelligence (BI) topics with a wide and diverse audience.  

The topics we covered ranged from the strategic and thought provoking, to the deep technical and “how-to” with a consistent focus on how to improve the analytics experience for you and your user community.

Over the course of the year we hosted 28 sessions focused on BI, most were either focused on a specific technology (Amazon QuickSight, IBM Cognos, Microsoft Power BI or Tableau) or a comparison on how these technologies addressed a capability such as Natural Language Query (NLQ), Embedded Analytics or Cloud BI.

Many of our sessions focused on our heritage as the go-to Cognos experts including deep dives into the modern BI features in Cognos Analytics including Data Modules, Data Sets and Explorations.  In one of our most highly anticipated (and highly attended) sessions, Rachel Su from IBM Offering Management joined Ironside to lead an overview of Cognos Analytics 11.1.7 – a role she reprised last month for Cognos Analytics 11.2).

In a number of other sessions, we explored Tableau new features, touched on many of the enterprise capabilities of Power BI and introduced Amazon QuickSight to our audience. 

Creating a Centralized Metadata Model in Power BI (4/16/20)

In our first session of the Take30 series, we explored the concept of shared datasets in Power BI and offered our point of view that, for many organizations who are maturing their Power BI capabilities, shared datasets mapped well to the “traditional” approaches of centralized (and governed) metadata, yet offered a degree of flexibility for decentralized teams to move at their own pace.  (Checkout this Playlist for Power BI)

Cloud BI: A Comparison of Leading Technologies (6/25/20)

As a majority of organizations see Cloud-based analytics as critical to their current and future analytics strategies, we thought it an opportune moment to take our audience through a review of the leading BI tools we work with on a daily basis.  

We reviewed the benefits of Cloud BI, including serverless and subscription-based licensing, then provided a comparison of vendors including Microsoft Power BI, Tableau, IBM Cognos and Amazon QuickSight.  

Amazon QuickSight – New Features (10/1/20)

While relatively new to the BI marketplace, we were excited to continue our focus on Amazon QuickSight and the significant progress the AWS team is making toward a solid enterprise featureset.  

Since that time, the roadmap and feature releases have become even more aligned to the enterprise reporting use case, especially in consideration of the compelling licensing story and scalable serverless architecture on which it is based.  (you may also want to check out this intro to QuickSight session  Introduction to Amazon QuickSight (5/7/20))

Enterprise Reporting: Assessment, Simplification and Migration (2/18/21)

Lastly, we wanted to address a topic that is of increasing prominence in our day to day conversations with clients – that of enterprise reporting migrations.  

In this session, we provided our point of view on the reasons why organizations migrate from their legacy tools, offered perspectives on approaches to migrations and the important pitfalls and lessons learned when considering such an initiative. 

We touched on tooling and accelerators we’ve developed to help those who have embarked on this journey reach their destination more quickly.

____

Throughout 2020, the Take30 webinar series gave our BI Experts a new way to connect with our clients and prospects in what was otherwise a challenging year. We confirmed that our participants are not only interested in diving deep into tool functionality, they are looking for guidance in managing multiple BI tools at enterprise scale, and understanding how cloud BI can enhance their analytics capabilities without breaking enterprise reports and functionality which are critical to their business operation.

Looking forward, we are going to explore those and other questions with you as we continue to share our knowledge and provide a mix of content; from the tactical to the strategic, across all the tools we help our clients with on a daily basis.

The Ironside Take30 webinar series premiered on April 16th, 2020, with the goal to share expert dialog across a variety of data and analytics related topics to a wide range of audiences. The series has three primary dialog categories, each hosted by a BI Expert, Data Scientist or Data Advisor. In the past year, we’ve shared best practices with over 200 companies ranging from Fortune 50 to small businesses. Our success has been measured by participants returning and telling a colleague; on average, each unique company attended over six Take30 sessions. 

While some Data Advisor sessions are more technical, the focus is on describing concepts and tools at a less detailed level. We want to give people a sense of how rapidly the data and analytics environment is changing. To that end, the Data Advisor series worked with our partners, including IBM, AWS, Snowflake, Matillion, Precisely and Trifacta, to bring demonstrations of their tools and discuss the impact of their capabilities. We talked about the rapid expansion both of data and of the solution space to move, structure, and analyze that data. 

Most importantly, we had a special series on the Modern Analytics Framework, Ironside’s vision for and approach to a unified approach to insight generation that puts the right data in the hands of the right people. Regardless of your industry, your tools, or your use cases, you need a way to keep your data, users, and processes organized.

“What do you need in your data warehouse?” used to be the chief question asked when thinking about data for analytics. That time is past. Now, a data warehouse is just one possible source of analytics. Most organizations have so much data that building a warehouse to contain all of it would be impossible. At the same time, data lakes have emerged as a popular option. They can easily hold vast amounts of data regardless of structure or source. But that doesn’t mean the data is easy to analyze. 

And just as there’s no longer a single question to ask about structuring data, there’s no longer just one voice asking the question. Data scientists and data engineers are among the many personas that have emerged as consumers of data. Each has their own toolset(s) and preferences for how data should look for their purposes. 

All of this diversity demands a more distributed approach to ingesting, transforming and storing data – as well as robust and flexible governance to manage it. All of the topics covered in the past year of Take30 with a Data Advisor touch on these points, and on Ironside’s goal to help you make better decisions using your data.  Here are five of the 27 Data Advisor sessions we hosted this year: 

  • Modern Analytics Framework: Series Summary  (7/30/20-9/1/21) – This 6-part series covers all aspects of Ironside’s Modern Analytics Framework: overall concepts, assessment and design, governance, identification of user personas, implementation, and usage. If you are looking to upgrade your existing analytics environment, or creating one for the first time, this is an essential series, and one that Ironside will be expanding on in 2021.

  • Snowflake as a Data Wrangling Sandbox (6/3/20) – Snowflake is a tremendous cloud database platform for data storage and transformation. Its complete separation of compute and storage allows for many usage scenarios, and most importantly for easily scalability based on volume of data and consumption. Nirav Valia (from Ironside’s Information Management practice) presents on one common Snowflake use case: using Snowflake as a data wrangling sandbox. Data wrangling typically involves unpredictable consumption patterns and creation of new data sets, as an analyst seeks to discover new insights or answer new questions by manipulating data sets. Snowflake’s power and flexibility easily handles these types of activities without requiring up-front investment or significant recurring costs. It’s easy to create transformations, let them run, then let the data sit until it is needed again. (If you are interested in Snowflake, also consider our later Take30 Snowflake: Best Practices (9/24/20), including commentary from a Snowflake engineer.) 

  • What is Analytics Modernization? How can Data Prep Accelerate It? (with Trifacta) (2/4/21) – Toward the end of our first year of Take 30s, we held a panel, hosted by Monte Montemayor of Trifacta, around data prep and accelerating analytics modernization. As I mentioned earlier, there is a tremendous amount of data available today – but getting it analytics-ready is a huge challenge. Tools like Trifacta (known as Advanced Data Prep, or ADP, in the IBM world) are extremely useful for giving analysts and business users the ability to visualize and address data quality issues in an automated fashion. This is useful for data science, dashboarding, data warehouses – any place where data is consumed. (If you are interested in Data Prep, check out IBM Advanced Data Prep in Action (7/8/20) and Data Wrangling made Simple and Flexible with Trifacta (5/6/20))

  • A Data Warehousing Perspective: What is IBM Cloud Pak™ for Data? (5/27/20) – IBM has created a single platform for data and analytics that works across cloud vendors and on-premise. If you want to be able to shift workload between local nodes and the cloud easily, this is the solution for you. In this Take30, we provide an overview of the technologies that make Cloud Pak for Data possible, and how you can take advantage of them. (We also have a session Netezza is back, and in the cloud (7/23/20) discussing Netezza, one of the many technologies available on the Cloud Pak platform)

  • A Data Strategy to Empower Analytics in Higher Ed (7/1/20) – Occasionally, we have the opportunity to host an industry-specific Take30, and where possible, we have clients join us. Northeastern University joins this Higher Ed focused Take30 to discuss their approach taken with Ironside in developing a multi-year roadmap. This was geared towards increasing the “democratization of data and analytics” by establishing the organizational foundation, technology stack and governance plan necessary to grow self service throughout the institution. Our discussion highlights the particular challenges of a decentralized, highly autonomous structure, and shared the value of a data science pilot in the admissions area executed during the strategy engagement to generate tangible results.

2020 was a unique year. At Ironside, it gave us the opportunity to reach out to customers in a new way – one that we are continuing into 2021. We look forward to more detailed sessions on the Modern Analytics Framework, and on trends and tools that we see gaining prominence. 

After a year of delivering these sessions, we’ve realized that customers are not only looking for specific solutions, but for a sense of where the analytics world is going. Which cloud platforms make the most sense? What transformation and data wrangling tools are the most useful? Should I redesign my warehouse or just add a data lake? We look forward to exploring those and other questions with you.

The integration of BI solutions within business process applications or interfaces has become a modern standard. Over the past two decades, Business Intelligence has dramatically transformed how data could be used to drive business and how business processes can be optimized and automated by data. With ML and augmented analytics movement, BI applications are vital to every organization. Analytics embedding enables capabilities such as interactive dashboards, reporting, predictive analytics, AI processing and more within the touch of existing business applications. This differs from traditional standalone BI applications that put all the capabilities of business intelligence directly within the applications on which users have already relied. Now you may ask, when should I consider embedding to maximize my ROI?

Embedding Use Cases

Bar graph with upward trend     Business Process Applications

In this case, the integration of data & analytics is embedded into applications used by specific personas. For instance, embedding historical client information into a CSR application. One outcome will be improved decision-making based on readily available customer insights and higher levels of user adoption.

Shopping cart    Software / OEM Solutions

Digital transformation is all about software. Data visualization, forecasting and user interactions are must-have features of every application. Save the time you would spend coding. Embedding analytics in software not only saves cost greatly but also prominently enhances functionalities of software application.

Forest scene     Portals / Websites

Integration of data into your website or portal is another popular option. The benefits are obvious – information sharing provides your customers with valuable insights through a unified platform; you are able to go to market much faster since you are reaching customers directly. It helps your customers access the data they need to make decisions better, quicker and within their fingertips.

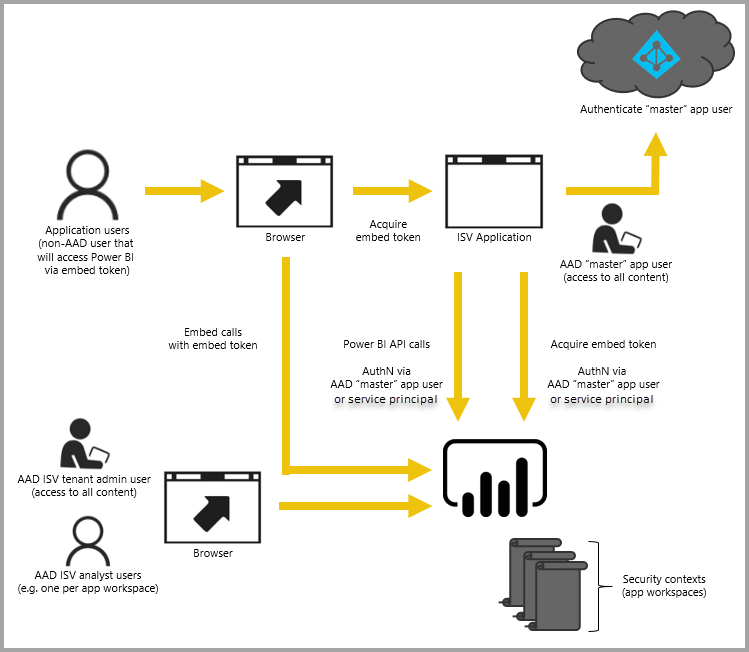
Embedding flow for embedding for your customers

Prepare for Embedding

Ready to get started? Let’s take a look at things to be considered. At a high level, the following areas to be carefully examined before design begins:

  • What are the embedding integration options? Especially with regards to security, how do you enable other application access to your secured BI assets? What are the options to manage authentication and authorization for thousands of users, both internally and externally?
  • Which functionalities will be open and accessible to BI embedding specifically? Typically not all UI functionalities are supported via embedding. Verify that critical functionalities are supported. Map your requirements to embedding functionalities and features.
  • Cloud vs On-premise hosting. Besides management and cost concerns, your organization may have cloud strategies and road-maps in place already. If that is the case, most likely no exception for BI application including embedding. Plus source data cloud modernization is another big driver to go with cloud. 
  • Cost – yes, no surprise there is cost associated with BI embedding. Each BI vendor may collect fees differently but legitimately you will need to pay BI embedding based on consumption pattern even when a single application user account is leveraged. Do the math so you know how much it will be on the bill. 

 Next let’s examine the tool differences. 

Embedding API by Leading BI Vendors

VendorAPIFunctionalities
IBM CognosSDK – Java, .NetMashup Service (Restful)New JavaScript API for DashboardNew REST API   Full programming SDK is almost identical to UI functionalitiesSDK can execute or modify a reportMashup service is easy to web embedding, limited report output formats are supportedJavaScript API and extension for dashboard, display/editNew REST API for administration 
Power BIREST APIJavaScriptREST: Administration tasks, though clone, delete, update reports are supported tooJavaScript: provides bidirectional communication between reports and your application. Most embedding operations such as dynamic filtering, page navigation, show/hide objects 
TableauREST APIJavaScriptREST: manage and change Tableau Server resources programmaticallyJavaScript: provides bidirectional communication between reports and your application. Most embedding operations such as dynamic filtering, page navigation
AWS QuickSightSDK – Java, .Net, Python, C++, GO, PHP, Ruby, Command lineJavaScriptSDK  to run on server side to generate authorization code attached with dashboard urlJavaScript: parameters (dynamic filters), size, navigation

BI embedding opens another door to continue serving and expanding your business. It empowers business users to access data and execute perceptive analysis within the application they are familiar with. Major BI vendors have provided rich and easy to use API, the development effort is minimum, light and manageable while the return benefits are enormous. Have you decided to implement BI Embedding yet? Please feel free to contact Ironside’s seasoned BI embedding experts to ask any questions you may have. We build unique solutions to fit distinctive requests, so no two projects are the same, but our approach is always the same and we are here to help.

What is Natural Language Query?

Natural Language Query is the ability to use natural language expressions to discover and understand data and accelerates the process of finding answers that data can provide. Another way to think about it would be a translation mechanism that helps bridge the gap between technical and non-technical users who may not understand which database has the data, which field to use or how to create calculations to answer their questions.

An example might be “How many customers made a purchase this month?” And the idea is that the tool would respond and give you answers and visualizations that answer that question or at least help you on the path to finding it.

From an industry perspective, in 2017, Gartner predicted that by 2020 half of all analytics queries will be generated using natural language processing. As of 2021, we have seen all of the leading vendors in the analytics space adding functionality like this and many have had this functionality for 2+ years.

Tableau – Ask Data

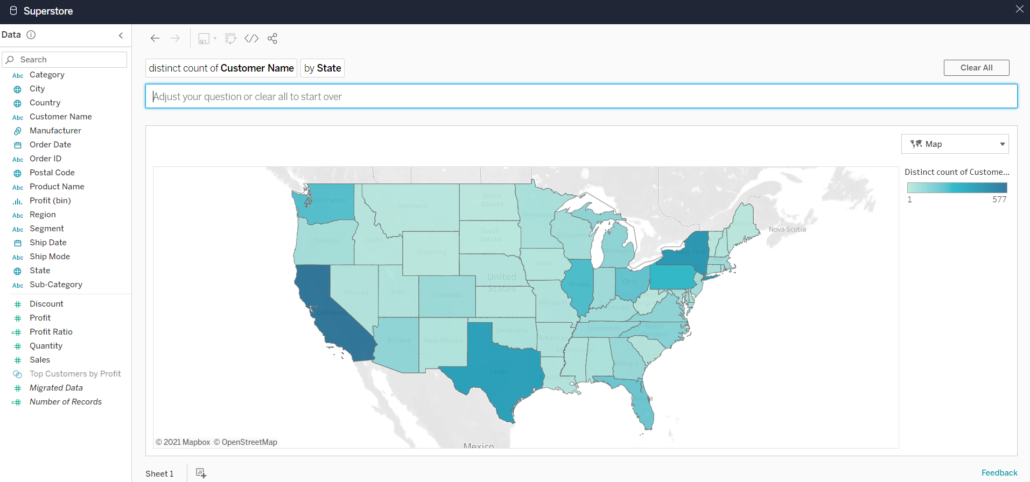
Tableau released Ask Data in version 2019.1 (February 2019) and has continued to enhance and improve its functionality. To use Ask Data, simply navigate to the desired data source in Tableau Online or Tableau Server, type in a question and Tableau will answer that question in the form of an automatically generated visualization. From there, you can customize the visualization, add additional filters and save your analysis as its own report. Ask Data will also recommend questions based on your data source and offer suggestions to refine your question as you’re typing. 

Another feature of Ask Data is the ability to create synonyms for fields so similar terms can be mapped to an existing field. If your business users are used to referring to customers as clients, you can add the word client as a synonym for the customer field in order for Ask Data to interpret the word client. For data source owners and Tableau administrators, Ask Data provides a dashboard that displays the most popular queries and fields, number of visualization results that users clicked, etc. to understand habits and behaviors of those using Ask Data with a given data source.

Power BI – Q&A

Power BI’s natural language query tool, Q&A, was released in October 2019 and is available in both Power BI Service and Desktop. In Power BI Service, Q&A is available in the upper-left corner of your dashboard. Similar to Ask Data, you can type in a question and Power BI will pick the best visualization to display your answer and if you’re the owner of the given dashboard, you can pin the visualization to your dashboard. It’s important to note that Q&A will only query datasets that have a tile on the dashboard you’re using so if you remove all the tiles from one dataset, Q&A will no longer have access to that dataset. To use Q&A while editing a report in Desktop or Power BI Service, select “Ask a Question” from the toolbar and type your question in the text box that appears.

Teach Q&A is a feature that allows you to train Q&A to understand words it doesn’t recognize. For example, someone asks “What are the sales by location?” but there is no field called “location” in the dataset. Using Teach Q&A, you can indicate that location refers to the region field and moving forward, Q&A will recognize that location means region.

Cognos Analytics – AI Assistant

AI Assistant was released in version 11.1 in September 2018 and can be used to explore data in Dashboards and Stories. AI Assistant is available by clicking the text bubble icon in the Navigation panel. Unlike the tools mentioned above, the AI Assistant interface appears more like a chat window where your conversation history is saved. You ask a question about the data, receive an answer, then can continue asking additional questions and scroll back in the history to view the whole “conversation”.  After asking a question, the AI Assistant will respond with an auto-generated visualization, that you can customize if desired, and then drag onto your dashboard canvas. 

Amazon QuickSight – Q

Amazon QuickSight, the newest of the tools discussed, released a preview of their natural language query tool, Q, in December 2020. Like the tools mentioned above, Q is a free-form text box found at the top of your dashboard where you can specify the data source you want to explore and ask your question. If Q does not sufficiently answer your question, you can provide feedback to correct the answer and that feedback is sent to the BI team to improve or enhance the data.

Overall

Tableau – Ask DataPower BI – Q&ACognos Analytics – AI AssistantAmazon QuickSight – Q
Release DateFeb 2019Oct 2019Sep 2018Dec 2020
Suggests Questions
Create Synonyms
Auto-Generates Visualizations
NLQ User Log

Overall, these tools are all similar in how they are used/function and all have the same goal – to make it easier and faster for business users to get answers from their data.

This blog post originated from our Take30 session around Natural Language Query, presented by Ursula Woodruff-Harris, Scott Misage, & John Fehlner.

The world has changed dramatically over the course of a single month, and companies are struggling even more with things that have historically challenged them:

  • Finding the best people to run, build and innovate on their analytics tools and data
  • Making these environments accessible to employees in a work-at-home model

In this Forbes article, Louis Columbus cites a recent Dresner survey that shows up to 89% of companies are seeing a hit to their BI and Analytics budgets due to COVID-19. The survey includes these two recommendations:

Recommendation #1

Invest in business intelligence (BI) and analytics as a means of understanding and executing with the change landscape.

Recommendation #2

Consider moving BI and analytical applications to third-party cloud infrastructure to accommodate employees working from home.


89% of companies are seeing a hit to their BI and Analytics budgets due to COVID-19.


We’re here to help you explore your options.

Now that the role of analytics is more important than ever to a company’s success, analytics leaders are again being asked to do much more with much less — all while companies are experiencing staff reductions, navigating the complexities of moving to a work-from-home model, and struggling to onboard permanent hires.

To address these short-term shortages (and potentially longer-term budget impacts), companies are naturally evaluating whether leveraging a managed-service approach — wholly or even just in part— can help them fill their skills gap while also reducing their overall spend.

As they weigh this decision, cost, technical expertise, market uncertainty and the effectiveness of going to a remote-work model are all top-of-mind. Here’s how these factors might affect your plans going forward:

Factor 1: Cost

As the Dresner number showed, most analytics teams need to reduce spend. Doing this mid-year is never easy, and usually comes at the expense of delayed or canceled projects, delayed or cancelled hiring, and possibly even staff reductions. All of these decrease a company’s analytics capabilities, which in turn decreases its ability to make the right business decisions at a critical time. A managed services approach to meeting critical analytics needs, even just to address a short-term skills gap, can provide valuable resources in a highly flexible way, while saving companies significant money over hiring staff and traditional consulting models.

Factor 2: Technical Expertise

A decade ago, your options for analytics tools and platforms were limited to a handful of popular technologies. Today even small departments use many different tools. We have seen organizations utilizing AWS, Azure, and private datacenters. Oracle, SQL Server, Redshift all at the same company? Yes, we have seen that as well. Some of our customers maintain more than five BI tools. At some point you have to ask: Can we hire and support the expertise necessary to run all these tools effectively? Can we find and hire a jack-of-all trades?

In a managed services model, companies can leverage true experts across a wide range of technology while varying the extent to which they use those resources at any particular time. As a result, companies get the benefit of a pool of resources in a way that a traditional hiring approach simply cannot practically provide.

Factor 3: Effectiveness of Remote Work Engagement

If you weren’t working remotely before, you probably are now. Companies are working to rapidly improve their processes and technologies to adjust to a new normal while maintaining productivity.

Managed service resourcing models have been delivering value remotely for years, using tools and processes that ensure productivity. Current events have not affected these models, therefore making them an ideal solution for companies  trying to figure out the best way to work at home.

Times are changing. We’re ready!

Ironside has traditionally offered Managed Services, to care for and maintain customer platforms and applications, and consulting services, to assist in BI and Analytics development.

Companies can leverage our Analytics Assurance Services temporarily, for a longer period of time to address specific skills gaps, or to establish a cloud environment to support remote analytic processes.

With Ironside, you can improve your data analytics within your new constraints, while reducing your costs. We’d love to show you how.

Contact us today at: Here2Help@IronsideGroup.com

Over the past week, I’ve spoken to a number of customers and partners who are adjusting to the ever-evolving reality of life during COVID-19. Beyond the many ways it has affected their personal lives and families, we’ve also discussed how it has impacted their jobs, and the role of analytics in the success of their organizations.

During these conversations, a few consistent themes have emerged from the people responsible for delivering reporting and analytics to their user communities:

  • Reliability: Continuing to deliver business as usual content despite a suddenly remote workforce
  • Resiliency: Hardening existing systems and processes to ensure continuity and security
  • Efficiency: Delivering maximum value even in the midst of a short-term business downturn
  • Innovation: Finding new ways to leverage data to address emerging challenges in areas such as supply chain, customer service, pricing optimization, marketing, and others.

While none of these topics are new to those of us in analytics, the new reality brought on by COVID-19 has made it even more important for us to succeed in every area. In an excellent Forbes article, Alteryx CEO Dean Stoecker discusses the importance and relevance of analytics professionals in driving success for their organizations in these trying times.

As he correctly concludes,

“If anyone is prepared to tackle the world’s most complex business and societal challenges—in this case, a global pandemic—it is the analytic community.”

We’re all in this together.

At Ironside, we’re taking that challenge to heart and looking at how we, too, can refocus our talents to better help our customers. Our upcoming series, Strategies for Success During Uncertain Times, will cover the steps we’re taking to help our partners weather this storm.

As of today, we’re:

  • Holding on-demand “Coffee Breaks” with some of our most experienced SMEs
  • Increasing remote trainings on key technologies
  • Rolling out short-term hosted platforms to accelerate model development, especially for predictive analytics
  • Expanding our managed-services capabilities for platforms and applications, even for short-term demand
  • Increasing our investment in off-shore capabilities to reduce costs and expand coverage models and other areas, too

Additionally, we are offering more short-term staffing options to our customers. Read Depend on Ironside for your data and analytics bench for short- and long-term success for more about these services.

We’re here to help.

At Ironside, we agree that the analytics community is uniquely-positioned to help our organizations weather the COVID-19 storm, and we’re committed to making our customers and partners as successful as possible.

We look forward to speaking with you about your immediate needs, and continuing the conversation on these and other timely topics.

Contact us today at: Here2Help@IronsideGroup.com

Ironside has historically focused on longer-term, project- or services-based staffing. However, we understand that what you may need most now is immediate, on-demand access to highly-experienced professionals.

To address that critical need, we’re making some of our top people available for short-term work. If you have even the most temporary and immediate need to address capacity constraints, delayed hiring, budget limits, or just to knock a few items off of your to-do list, we can assist with a flexible, remote, talented, and cost-effective pool of professionals. Our areas of expertise include:

  • IBM Analytics portfolio including Cognos, Watson, Netezza and others
  • BI tools including Tableau, Power BI, QuickSight and others
  • Cloud-native technologies on AWS and Microsoft
  • Leading data wrangling, management, and catalog tools
  • Top AI and AML technologies from DataRobot, AWS, and more

The world may be up in the air, but we understand that it has to be business as usual for our clients. We’re here to help you with that.

Contact us today at: Here2Help@IronsideGroup.com